The Regime Investor· · ·17 min read
Who captures the profit from AI investment: chipmakers or platforms?
Samsung, SK hynix, Alphabet and Amazon show where AI spending becomes cash flow, while Microsoft and Meta reveal commitments that current capex does not capture.
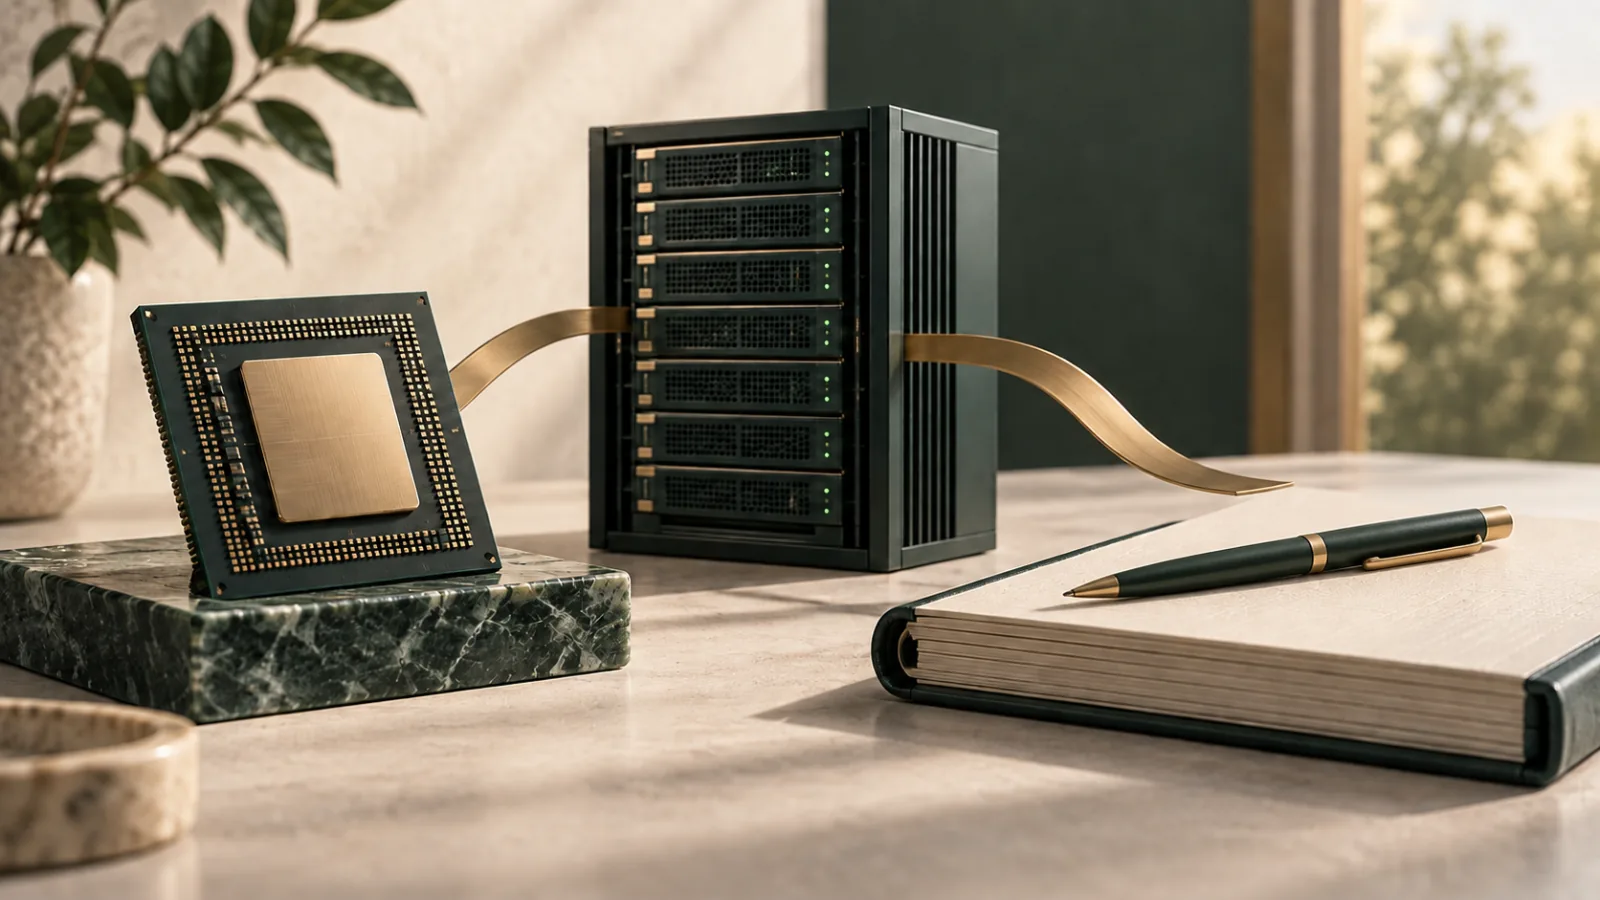
AI investment creates revenue at several points in the value chain, but it does not create the same economics for every company. Memory manufacturers can benefit early when high-bandwidth memory and server products are scarce. Platforms may capture value later by selling the same computing capacity through cloud services, advertising, subscriptions and enterprise software.
The useful question is not whether chipmakers or platforms are the single winners. It is where additional revenue becomes durable margins and free cash flow after capital expenditure, depreciation, power costs and financing are taken into account.
Two business models, two paths to profit
Samsung Electronics and SK hynix supply high-bandwidth memory (HBM), server DRAM and enterprise solid-state drives used in AI data centres. HBM stacks memory chips vertically, linking the layers with electrical connections through the silicon so AI processors can move large volumes of data quickly. When demand grows faster than qualified supply, shipment volumes, pricing and product mix can all improve. If HBM production redirects capacity that might otherwise serve conventional DRAM, the mix shift can also affect the broader memory market.
Alphabet and Amazon sit further downstream. They buy or design processors, build data centres and connect that infrastructure to cloud computing, AI models, search, advertising, subscriptions, commerce and workplace software. Their advantage is not lower capital intensity. It is the possibility of using the same infrastructure across several products and customer groups.
The two models therefore face different tests. Memory suppliers need scarcity and product leadership to last long enough for high prices to become cash. Platforms need paid usage to grow faster than the cost of building and operating the infrastructure.
What memory companies are earning now
Samsung’s second-quarter 2026 results showed its memory business reaching record quarterly revenue and operating profit. The company attributed the result to server-focused AI demand, limited capacity, stronger prices and a higher-value product mix. It also reported expanding HBM4 sales and expected demand for server DRAM, enterprise SSDs and HBM to remain firm while supply constraints persisted.
SK hynix reported a similar transmission path. HBM, AI-server DRAM and enterprise SSDs helped drive record quarterly performance. The company began mass shipments of HBM4, said it had finalised long-term agreements with about 10 customers and reported a stronger net cash position.
Those disclosures show that AI infrastructure spending is already reaching memory suppliers as realised revenue, operating profit and cash generation. It is not merely a future theme.
That does not make today’s margins permanent. Memory remains cyclical. Attractive prices encourage investment, new supply arrives with a lag and margins can contract quickly when scarcity eases. Production yields, contract terms, Chinese capacity, customer concentration and the pace of custom-chip adoption all affect how long the current advantage can last.
What SK hynix’s KRW40 trillion buyback can—and cannot—change
SK hynix’s 19 August 2026 regulatory filing records a board-approved on-market repurchase of KRW40 trillion, with all shares acquired under the plan to be cancelled. At the previous day’s closing price of KRW1,662,000, the company estimated that the plan represented about 24.07 million shares, or 3.3 per cent of issued shares. The purchase period began on 20 August and is scheduled to run for about three months.
This is an authorised plan, not a completed cancellation. The average purchase price, the number of shares actually acquired and the final cancellation still have to be observed. It would therefore be premature to say that the issued share count has already fallen by 3.3 per cent.
Cancellation matters because the shares do not remain as treasury stock that might later be reissued. If the plan is completed without offsetting dilution, each remaining share will represent a larger proportion of the company. That mechanical change does not guarantee an equal increase in economic value. The result still depends on the purchase price, the source of funding, the returns available from alternative uses of cash and the durability of future profits.
SK hynix also raised its total shareholder-return target from within 50 per cent to over 50 per cent of cumulative free cash flow for 2025–2027. The company plans to combine repurchases and cancellations with dividends, and is considering larger fixed and special dividends. The amount and form of any further return have not been fixed; the company said details would follow board approval at the time of its third-quarter results.
The balance sheet gives the company room to act, but it does not remove the trade-off. SK hynix reported preliminary second-quarter revenue of KRW79.3187 trillion, operating profit of KRW60.5426 trillion and net cash of KRW69.4 trillion. Those figures remain subject to the company’s stated review and audit caveats, while investment in production capacity and advanced packaging continues.
Australian investors may encounter SK hynix directly through its US-listed depositary securities or indirectly through global and Asian equity funds. The useful question is whether the repurchase converts surplus cash into durable value per share without weakening the company’s ability to fund the next investment cycle.
Evidence to track includes:
- cumulative shares bought and the average purchase price
- completion of the cancellation and the resulting issued share count
- any additional dividend or shareholder-return plan announced with third-quarter results
- operating cash flow after capital expenditure
- net cash and investment capacity after the repurchase
- HBM pricing, shipments and long-term agreements, as well as conventional-memory inventory
- any share issuance or equity-linked compensation that offsets the reduction
A large cancellation can be constructive capital allocation. It becomes less effective if a cyclical company buys near peak earnings or uses cash later needed for capacity, technology or a downturn. The KRW40 trillion headline should therefore be read alongside the execution price, evidence of cancellation and cash generation through the cycle.
Why platforms have more routes to monetisation
Alphabet reported second-quarter revenue growth of 24 per cent, with Google Cloud revenue up 82 per cent to US$24.8 billion. Search and other revenue rose 17 per cent, while YouTube advertising revenue rose 13 per cent. These businesses give Alphabet several ways to use and sell the computing capacity it is funding.
The cash-flow picture adds an important qualification. Alphabet spent US$44.9 billion on property and equipment during the quarter and reported quarterly free cash outflow of US$5.9 billion. Its trailing 12-month free cash flow remained positive at US$53.3 billion, so one investment-heavy quarter is not the whole business. It does show why cloud growth and capital intensity need to be read together.
Amazon reported 37 per cent growth in AWS sales and higher AWS operating income. It also said its AI and custom-chip businesses had each passed a US$25 billion annual revenue run rate. Yet trailing 12-month free cash flow was an outflow of US$7.6 billion, reflecting a sharp increase in property and equipment spending, mainly for AI.
This is the strongest part of the platform case: an established customer base and several payment channels can spread the cost of AI infrastructure across more products. But a wide monetisation surface is not the same as a high return on invested capital. Revenue still has to outrun depreciation, power, labour and financing costs.
Capex does not show the whole funding burden
Property-and-equipment spending is only one part of the cost of expanding AI infrastructure. A company can also commit to data-centre leases that have not started, long-term purchases of chips, servers and power, or guarantees attached to jointly financed projects. These arrangements may become future cash outflows or recognised liabilities even though they do not all appear in current capex.
They should not all be called current debt. Microsoft disclosed US$196.6 billion of additional leases, mainly for data centres, that had not commenced at 31 March 2026. The leases were scheduled to begin between its 2026 and 2031 financial years, with the relevant right-of-use assets and lease liabilities recognised after commencement.
Meta disclosed US$237.67 billion of non-cancellable contractual commitments at the same reporting date, mostly related to third-party cloud capacity and other technical-infrastructure investment. Its Louisiana data-centre venture included an initial lease commitment of about US$12.31 billion and residual-value guarantees with a threshold of about US$28 billion. Meta said payments under those guarantees were not probable at that date, so it had not recorded a liability for them.
These categories have different timing and risk. Current balance-sheet debt, a lease that starts in a future period, an order for equipment that has not been delivered and a guarantee payable only under specified conditions are not interchangeable. Adding them into one ‘hidden debt’ figure can exaggerate the immediate obligation. Looking only at capex can make the opposite error by understating long-dated commitments.
Large commitments are not evidence that AI demand has already failed. They can also show that companies expect infrastructure demand to persist. The view should change when paid usage, contract performance, financing costs, depreciation and free cash flow deteriorate together—not merely because the gross commitment number is large.
Not every AI customer has the same funding resilience
Treating every AI-infrastructure customer as if it had the same balance sheet can distort the durability of memory demand. A cash-rich platform funding investment from several mature businesses does not respond to higher rates in the same way as a specialist cloud operator that relies more heavily on debt, leases, equipment finance and new equity.
Alphabet’s filing shows US$80.6 billion of capital expenditure in the first half of 2026, US$98.2 billion of long-term debt at the end of the period and US$85.2 billion of future payments under data-centre leases that had not yet commenced. It also issued a combined US$51.8 billion of US-dollar and foreign-currency senior notes during the first half.
This does not make Alphabet financially fragile. Its established businesses generate substantial operating cash flow and provide a different funding base from a young infrastructure provider. It does show that even a cash-generative platform can expand debt, leases and future commitments quickly when AI capacity is built at scale.
CoreWeave’s first-quarter filing reported US$2.078 billion of revenue, a US$144 million operating loss and US$536 million of net interest expense. Property and equipment, net, reached US$36.4 billion. The company also reported US$25.1 billion of total indebtedness and an estimated US$40.7 billion of future undiscounted payments under leases that had not yet commenced.
Strong revenue growth and a large infrastructure footprint can therefore coexist with substantial financing dependence. The risk is not that every debt-funded project must fail. It is that refinancing cost, equipment values, customer concentration or a delay in contracted demand can reach a specialist provider’s investment plan sooner than they reach a diversified platform’s.
Supplier-arranged financing can bring orders forward
AI chip demand can become a firm order through more than a customer’s operating cash. Broadcom, Apollo and Blackstone launched the AI XPV Platform with an initial US$35 billion transaction led by Apollo in partnership with Blackstone. It is intended to support more than one gigawatt of Anthropic compute capacity, while the wider platform is designed to enable more than 20 gigawatts through 2028 using Broadcom XPUs and networking solutions.
Combining capital, equipment and long-term usage contracts can bring forward supplier orders, but it makes current customer cash flow a less complete measure of demand durability. The full US$35 billion should not be treated as Broadcom debt or revenue: the official announcements identify the capital providers but do not set out every borrower’s legal responsibility or Broadcom’s complete guarantee exposure in one headline figure. Larger funding proposals have been reported, but no primary disclosure was found showing a further transaction completed on the same terms.
The value-chain test is therefore to identify the borrower, asset owner, contracted repayment cash flow and guarantees before treating financed capacity as durable end demand. If the structure performs, data-centre orders and HBM demand may persist for longer. If rates, credit spreads, commissioning delays or end-user revenue deteriorate, stress can instead reach cancellations and price negotiations. The dedicated follow-up, AI’s debt boom: where data-centre risk sits off balance sheet , carries the contract, maturity and loss-waterfall checklist.
The supplier-side evidence remains an important counter-signal. SK hynix reported record quarterly revenue and operating profit, began mass shipments of HBM4 and described multi-year agreements with around 10 key customers. AI memory demand is already appearing in sales, profit and longer-dated contracts rather than existing only as a forecast.
These facts should be held together. Higher long-term rates do not mean every AI order disappears at once, and record memory earnings do not remove the funding risk of weaker customers. The practical test is whether stress at the financing-dependent edge of the customer base spreads into cancellations, slower capacity additions, weaker HBM pricing or rising inventory.
Chipmakers and platforms are complements
When platform AI revenue grows, demand for accelerators, memory and data-centre equipment tends to rise. When memory is scarce, the platform’s cost of delivering AI services also rises. If customers do not pay enough for those services, data-centre investment can slow and hardware orders may follow with a lag.
The near-term profit pool can therefore sit with scarce components, while the long-term investment cycle depends on platforms proving that AI services generate repeat revenue and cash. Treating the choice as chips versus platforms misses that feedback loop.
Custom silicon does not automatically break the relationship. It may reduce dependence on some merchant processors or improve the amount of work completed per dollar, but advanced systems still require memory, storage, networking and power. At the same time, more complex AI agents can perform repeated inference and external calls, increasing total infrastructure use even if each individual task becomes cheaper.
Questions to track across the chain
- Are higher memory prices lifting shipment volumes, operating profit and free cash flow together?
- Do HBM yields, pricing and customer commitments remain strong after capacity expands?
- How much announced spending has become a firm order, an energised data centre and paid utilisation, and is each customer funding it with operating cash or relying on debt, leases or equipment finance?
- Are memory suppliers’ inventories and receivables growing faster than revenue and cash collection?
- Is cloud and AI-service revenue growing faster than data-centre depreciation, power and interest costs?
- Is usage converting into paid, recurring revenue rather than remaining concentrated in free or promotional access?
- Are financing costs or future commitments beginning to weaken customer free cash flow, project completion or orders?
- If platforms slow their investment, how long does it take for orders and pricing to reach memory and equipment suppliers?
No single quarterly figure answers the whole set. Revenue growth can coexist with weak cash conversion, while a temporary free-cash-flow decline can accompany investment that later earns an attractive return. The pattern across several reporting periods matters more than one headline.
Counter-signals and what would change the view
The view on memory suppliers would weaken if supply normalised faster than expected, competing capacity expanded materially, HBM yields improved across the industry or customers reduced their dependence on merchant memory. The platform case would strengthen if paid usage accelerated while inference costs fell and free cash flow recovered despite continued investment.
The opposite outcomes matter too. Persistent memory shortages could keep hardware margins high but also make AI services more expensive to deliver. Strong cloud revenue could still disappoint shareholders if depreciation, financing or repeated capital raising absorbed too much of the operating gain.
Server shipments, memory pricing, cloud revenue, depreciation and free cash flow are more useful than product announcements alone in deciding which effect is dominating.
Cash-rich platforms, financing-dependent infrastructure specialists and projects that have not yet secured power or facilities should not be treated as one pool of demand. The view changes when stress among the more vulnerable customers begins to spread into broader order cancellations and pricing, or when long-term contracts and supply constraints continue to absorb that stress.
What this means for an Australian portfolio
Australian investors can encounter this theme through direct overseas shares, global equity ETFs and investment options inside superannuation. That makes the question broader than choosing four foreign companies. An apparently diversified global fund may already have substantial exposure to the same large US platforms, while Korean memory suppliers may sit in a different fund, index or market allocation.
Returns measured in Australian dollars can also diverge from the underlying company result. Samsung and SK hynix report in Korean won, while Alphabet and Amazon report in US dollars. Currency can amplify or offset the equity return, but it does not change the operating economics described above.
Valuation, concentration, liquidity, tax and capacity for loss still matter. A sound view of the AI value chain does not determine an appropriate position size for a particular investor.
Follow the cash, not a permanent winner
The second-quarter 2026 results show AI spending reaching both memory suppliers and platforms through different profit mechanisms. Memory companies currently benefit more directly from scarcity, pricing and product mix. Platforms have more ways to monetise the infrastructure, but their capital spending must eventually translate into durable free cash flow.
The practical task is to follow where pricing power lasts and where each additional dollar of investment produces repeatable cash. That comparison is more useful than declaring one permanent winner across the entire AI value chain. For a broader view of how capital expenditure and corporate profits interact with the market cycle, see Why market regimes matter more than predictions .
The follow-up AI’s debt boom: where data-centre risk sits off balance sheet traces what happens when construction funding moves through bonds, private credit, special-purpose vehicles and long contracts.
Update note
Revision history
Affected reader-facing headings:
- Two business models, two paths to profit
- What SK hynix’s KRW40 trillion buyback can—and cannot—change
- Not every AI customer has the same funding resilience
- Questions to track across the chain
- Sources
This update adds a brief stacked-memory explanation of HBM in Two business models, two paths to profit, with its official Samsung Semiconductor reference under Sources. It links the exact DART filing for the buyback decision. Within Not every AI customer has the same funding resilience, it renames and compresses the supplier-arranged financing subsection while preserving the confirmed transaction evidence, the distinction between diversified platforms and financing-dependent specialists, and the supplier counter-signal. The overlapping contract and maturity checklist now sits in the dedicated off-balance-sheet debt follow-up, while the cross-chain questions keep the shorter cash-flow and order-transmission tests.
Update note
Revision history
This update expands the following sections:
- Capex does not show the whole funding burden
- Eight questions to track
The article now separates current debt from uncommenced leases, purchase commitments and conditional guarantees, including when each category can become a cash outflow or recognised liability.
Update note
Revision history
This update expands the following sections:
- Capex does not show the whole funding burden
- Questions to track across the chain
- Counter-signals and what would change the view
It separates cash-generative platforms from more financing-dependent AI-infrastructure customers and traces how operating cash, debt, leases and equipment finance can reach memory orders. Alphabet, CoreWeave and SK hynix disclosures are compared without assuming that higher rates erase every order or that record memory earnings remove customer-financing risk.
Update note
Revision history
Update note
Revision history
Analysis update · “Not every AI customer has the same funding resilience”
This update adds supplier-arranged data-centre financing alongside operating cash, bonds and leases. The Broadcom AI XPV Platform’s confirmed initial US$35 billion transaction illustrates why the borrower, asset ownership, contracted cash flow, guarantees and loss ranking must be checked separately from the order headline. The checklist now also covers mismatches between commissioning and refinancing dates, and concentration in one end user or long-term contract.
Update note
Revision history
This article provides general information and does not take account of your objectives, financial situation or needs. It is not personal financial advice or a recommendation to buy, hold or sell any security.
Sources
- Samsung Electronics — second-quarter 2026 results
- Samsung Semiconductor — HBM product overview
- SK hynix — second-quarter 2026 financial results
- SK hynix — 19 August 2026 regulatory filing on the treasury-share acquisition decision
- SK hynix — KRW40 trillion share repurchase, cancellation and shareholder-return expansion
- SK hynix — shareholder-return policy
- Alphabet — second-quarter 2026 earnings release
- Google — second-quarter 2026 management commentary
- Amazon — second-quarter 2026 results
- Microsoft — third-quarter 2026 lease disclosure
- Meta — Form 10-Q for the quarter ended 31 March 2026
- Alphabet — Form 10-Q for the quarter ended 30 June 2026
- CoreWeave — Form 10-Q for the quarter ended 31 March 2026
- Broadcom — AI XPV Platform launch and initial US$35 billion transaction
- Apollo — US$35 billion capital solution for the Broadcom AI XPV Platform
- Broadcom — Form 8-K on its Google and Anthropic arrangements
More through this lens