The Regime Investor· ·5 min read
Why Australian house-price forecasts miss turning points
Treat Australian house-price forecasts as conditional maps by tracking credit, listings, seller behaviour and financial-stress signals before the price index turns.
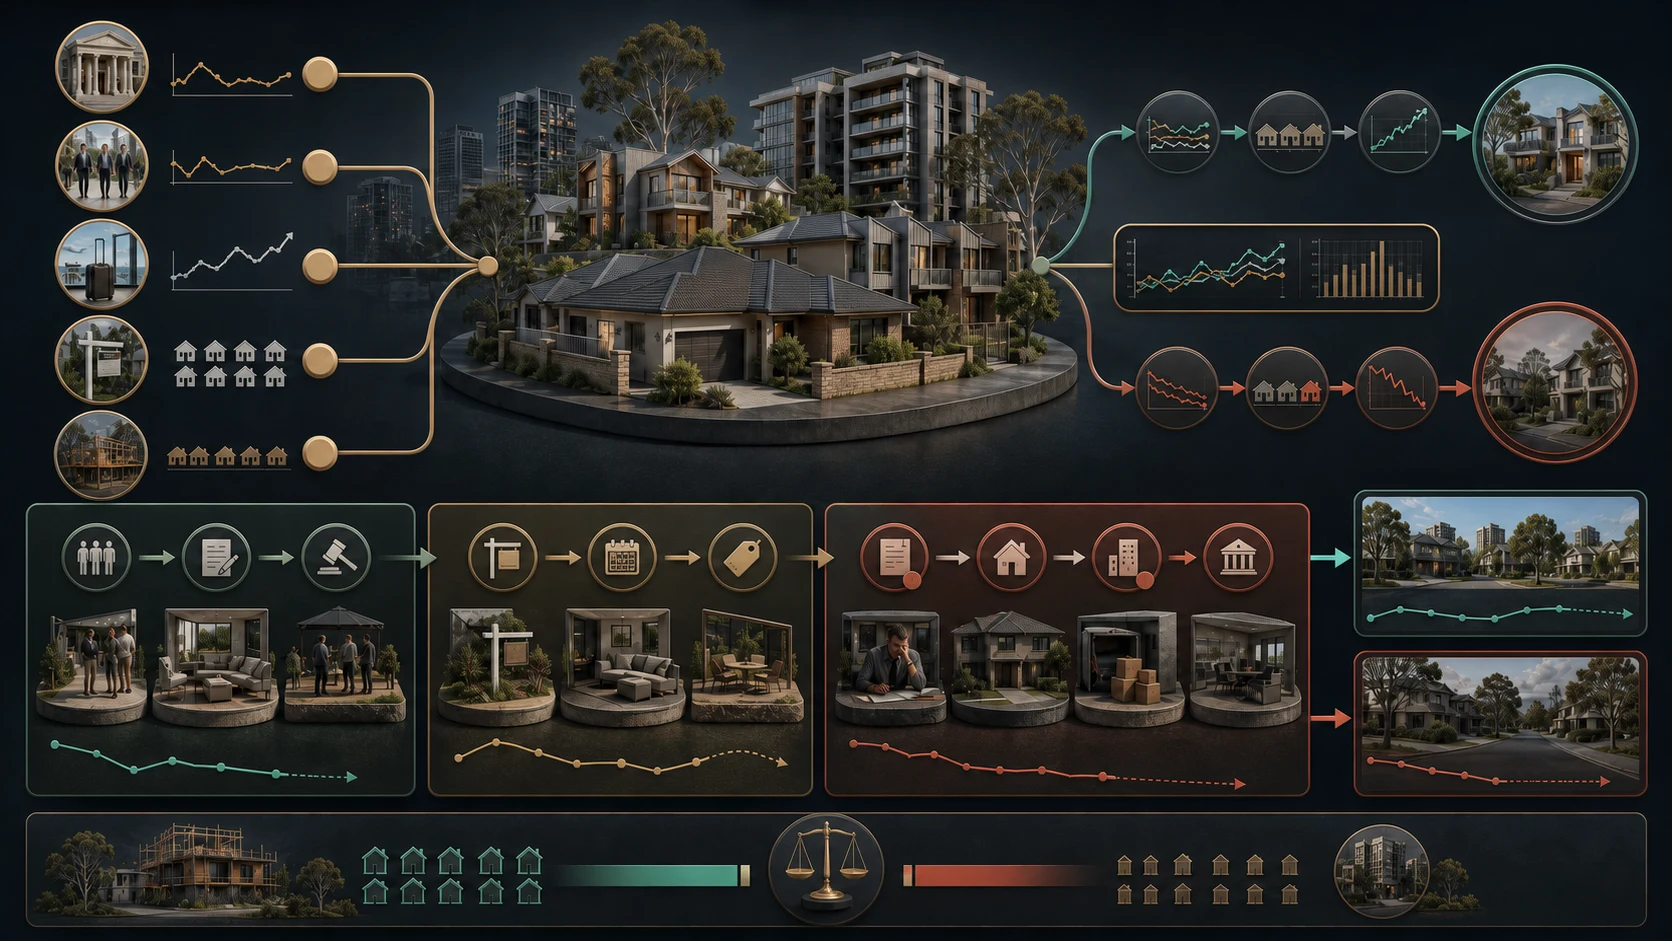
A house-price forecast can look precise because it ends in one percentage. The path to that number is much less precise.
Australian housing turns when interest rates, borrowing capacity, employment, migration, listings, tax policy and construction capacity interact. A forecaster can estimate each variable reasonably and still miss the turning point because the relationships change, the data arrive late and buyers react before the official series confirms the shift.
The lesson is not to ignore forecasts. It is to read them as conditional maps and watch the assumptions that can move first.
Evidence cut-off: 23 August 2026.
A forecast is a bundle of assumptions
A typical housing outlook contains an expected cash-rate path, an estimate of household income, a view on population growth, a credit response and a supply assumption. Change one of those inputs and the same model can produce a different price path.
The Reserve Bank’s February 2026 assessment described strong housing-price and credit growth after the 2025 easing cycle. By August, the RBA reported that established housing conditions had softened more than expected, prices had fallen 1.6 per cent from their March peak, auction clearance rates were below long-run averages and sentiment had weakened.
That change does not prove the earlier analysis was careless. Rates, tax policy and the broader economic environment changed. The useful question is which assumption moved, how quickly the model absorbed it and what evidence would reverse the new view.
Turning points appear in flows before stocks
House prices are a slow, revised measure. A dwelling may be listed, passed in, relisted, negotiated and settled months before the final transaction enters a price index.
Faster indicators can weaken first:
- new loan applications and commitments;
- auction clearance rates and withdrawal rates;
- days on market and vendor discounting;
- the number of fresh listings compared with completed sales;
- investor and owner-occupier credit growth;
- buyer sentiment and search activity.
These are not interchangeable. A clearance rate can fall because reserve prices are unrealistic, while total listings remain tight. Loan commitments can fall because rates reduce borrowing capacity even though employed owners are not under pressure to sell. Several measures moving together is more informative than one dramatic weekly number.
Migration and supply work on different clocks
Population growth can support rental demand quickly, but new construction takes years. It is tempting to translate strong migration directly into higher purchase prices.
That shortcut misses financing. New households still need deposits and serviceable loans. Investors compare rents with interest, tax, maintenance and vacancy costs. Builders need presales, labour, materials, approvals and grid or transport infrastructure.
A structural shortage can therefore coexist with a cyclical downturn. It may create a floor over several years without preventing prices from falling when credit tightens today.
Why previous forecasts can fail in both directions
A bearish forecast can miss the upside when migration, employment, fiscal support or accumulated savings prove stronger than expected. A bullish forecast can miss the downside when rate expectations turn, policy changes affect investors or credit approvals slow faster than income data.
Forecast errors become larger when a model treats these relationships as stable. The sensitivity of prices to rates is not fixed: it depends on leverage, refinancing, available listings, investor participation and the starting valuation. The same cash-rate move can have a different effect in Sydney, Melbourne, Perth or a regional market.
Revisions also matter. A forecaster may appear to have missed a turn when the real-time data available at the decision date were later revised. Fair evaluation uses the information that was available then, not the final series visible months later.
A three-stage turning-point dashboard
Instead of choosing the most confident forecast, separate the market into three stages.
Stage 1 — demand softens
Watch loan commitments, auction clearance, sentiment, search activity and investor credit. Prices may still rise because listings are scarce.
Stage 2 — sellers adjust
Watch fresh and total listings, days on market, vendor discounts, withdrawals and the share of loss-making resales. A rise in listings matters more when sales fail to absorb it.
Stage 3 — housing becomes financial stress
Watch unemployment, hardship, arrears, refinancing failures, forced sales, construction insolvencies, bank provisions and funding spreads. Falling prices alone do not establish this stage.
The current distinction is important. The RBA’s March 2026 Financial Stability Review found that arrears were low, most borrowers retained substantial buffers and banks were well capitalised. Its August statement nevertheless showed a weaker established-housing market and restrictive financial conditions. Slower prices and system-wide stress are different states.
The Australian housing financial-stress dashboard examines that third stage in more detail.
How to use a forecast without becoming trapped by it
Record the forecast date, horizon and assumptions. Then write down what would make it wrong.
A forecast for national prices should not be judged against one city. A six-month call should not be rescued with a five-year shortage story. A nominal price forecast should not be confused with an inflation-adjusted return. And a price forecast says little about an individual owner’s cash flow unless mortgage costs, rent, tax, insurance and maintenance are included.
The three household buffers—equity, serviceability and accessible cash help connect a market forecast to household resilience.
Counter-signals and conditions that would change the view
The case for a housing downturn weakens if loan commitments recover, auction withdrawals fall, vendor discounts stabilise and new listings are absorbed without a rise in arrears or forced sales. It strengthens if demand indicators stay weak, sellers cut prices across several markets and unemployment, hardship or refinancing failures rise together.
The best housing forecast is not the one with the most precise number. It is the one whose assumptions are visible, whose errors are recorded and whose turning signals can be checked before the final index confirms what has already changed.
This article provides general information only and does not replace personal property, lending, investment, legal or tax advice.
Sources
More through this lens