The Regime Investor· · ·10 min read
Hormuz is not binary: what bypass pipelines can and cannot solve
Saudi and UAE bypass pipelines can soften a Hormuz disruption, but terminals, insurance and LNG remain constraints; diplomatic language alone does not prove physical recovery.
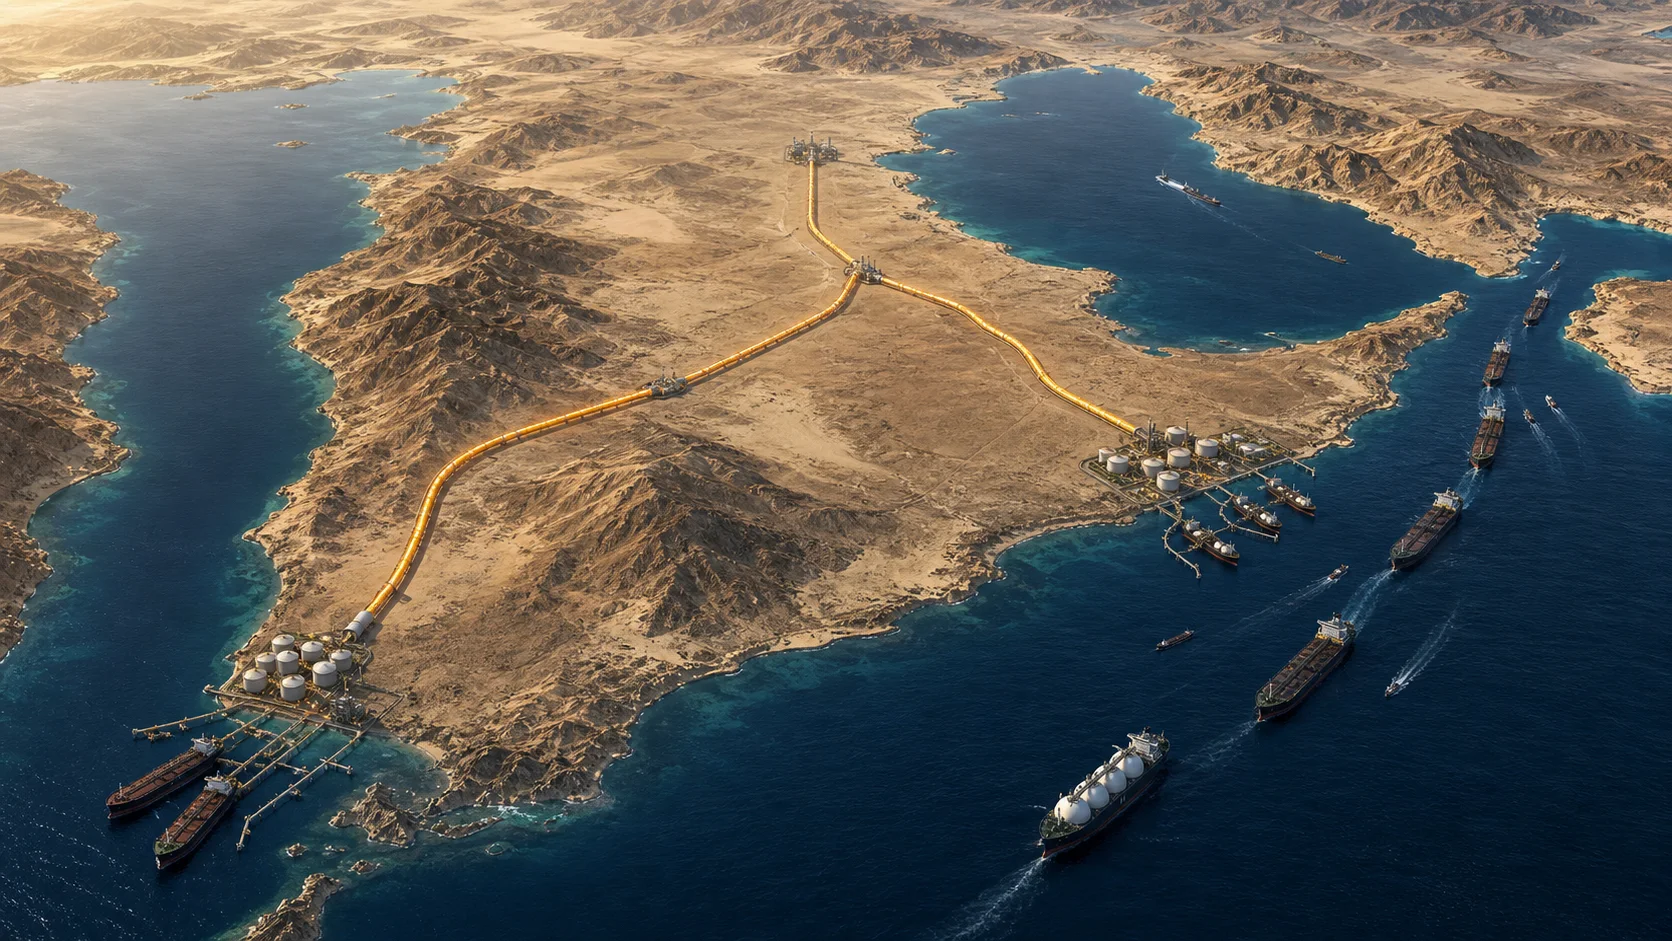
The Strait of Hormuz is not simply open or closed. Oil can move through the strait, around it by pipeline, out of storage beyond it or between ships. Each option can soften a disruption. None can replace the entire network of crude, refined products and LNG that normally uses the route.
That is the practical answer to the title. Saudi Arabia and the United Arab Emirates have meaningful crude-oil bypass capacity, but it covers only part of the usual flow. The pipelines also end at ports with their own storage, berth and tanker constraints. They do not reroute LNG, and they do not make insurance or crew-safety risks disappear.
For an Australian investor, the useful question is not whether a headline says Hormuz has reopened. It is whether loaded energy is arriving, at what freight and insurance cost, and how those costs reach Australian fuel users and company margins. The official-data cut-off for this assessment is 25 August 2026.
The latest evidence still shows an incomplete recovery
The US Energy Information Administration estimates that crude oil and petroleum liquids moving through Hormuz averaged 21.6 million barrels a day in the fourth quarter of 2025, but only 4.9 million in the second quarter of 2026. The International Energy Agency says Gulf exports, including bypass volumes, averaged 15 million barrels a day in July. Loadings reached about 20 million early in the month, then fell to roughly 12 million later.
Those figures cover different periods and definitions, so they cannot be joined into one continuous series. They do, however, point in the same direction: the strong early recovery did not become a stable return to normal. The EIA also warns that AIS reporting around Hormuz has been especially unreliable in 2026. A count of visible ships is therefore weaker evidence than reconciled estimates using vessel type, cargo, departure and destination data.
Bypass pipelines cover only part of the gap
The IEA estimates that close to 20 million barrels a day of crude oil and petroleum products passed through Hormuz in 2025. Depending on operating conditions, Saudi Arabia and the UAE together may have about 3.5 million to 5.5 million barrels a day of additional operational bypass capacity.
This is a large buffer in absolute terms. It can keep several million barrels moving and reduce the worst-case shortage. It is not a substitute for the strait. Even the top of the estimated spare range is only a fraction of the usual Hormuz flow, and that arithmetic excludes LNG.
Nameplate pipeline capacity is not the same as exportable supply. The whole chain has to work: the right crude grade must enter the line; pumps and storage must handle it; the receiving port must have a free berth; and a suitably insured tanker must be available to load it. A bottleneck at any link reduces the useful capacity of the route.
Saudi Arabia’s East–West route buys time, not immunity
Saudi Arabia’s East–West pipeline moves crude from facilities near the Gulf to Yanbu on the Red Sea. Its reported expanded capacity is about 7 million barrels a day, although the IEA notes that sustained operation at that level has not been fully tested. After allowing for volumes already using the line, estimated spare potential in early 2026 was roughly 3 million to 5 million barrels a day.
The range matters more than the headline maximum. Pumping conditions, crude compatibility, west-coast storage and Yanbu’s loading capacity determine how much can be sustained. If the line runs hard while cargoes queue at the terminal, the constraint has moved rather than disappeared.
The same caution applies to inventory. Crude released from onshore or floating storage can lift exports for a time without restoring field production. Pipeline throughput, storage withdrawals and vessel loadings describe different stages of the same barrel. Adding all three as new supply would double-count the recovery.
The UAE route ends at another concentrated hub
The Abu Dhabi Crude Oil Pipeline carries crude from Habshan to Fujairah, outside Hormuz. Its reported capacity is about 1.8 million barrels a day. The IEA estimated that approximately 1.1 million barrels a day were already using it in early 2026, leaving up to 700,000 barrels a day of extra room.
Fujairah’s storage, refining and ship-to-ship transfer infrastructure makes it a valuable alternative outlet. Concentrating more cargoes there also concentrates operational risk. Berth congestion, weather, storage availability, tanker scheduling, insurance restrictions or a verified security incident could all reduce effective throughput.
That does not mean an outage should be assumed. It means a serious assessment must observe terminal loadings and waiting times rather than treating the pipeline’s nameplate number as delivered barrels.
LNG has no comparable escape route
Oil dominates the discussion because oil has the visible pipeline alternatives. LNG is harder to reroute. The IEA estimates that about 93 per cent of Qatar’s LNG exports and 96 per cent of the UAE’s normally pass through Hormuz. Together, the two exporters account for about 19 per cent of global LNG trade.
An oil pipeline cannot carry LNG. If crude bypass flows improve while LNG shipping remains constrained, Asian gas buyers can still face tighter cargo availability, higher spot prices and more expensive LNG freight. Australia is an LNG exporter, but that does not make every listed company or domestic energy user a simple beneficiary. Contract pricing, uncontracted volumes, operating reliability, domestic commitments and currency exposure determine who captures a higher regional price.
Crude, products and shipping costs recover on different clocks
The IEA’s August 2026 Oil Market Report put global refinery throughput at 80.9 million barrels a day in July, nearly 5 million below a year earlier. Seaborne trade in refined products was down 3.8 million barrels a day year on year. Tight diesel, jet-fuel and petrol markets pushed Atlantic Basin cracks and margins to record levels.
A lower Brent price can therefore coexist with expensive transport fuel. Refineries need crude, power, labour and safe shipping, then product tankers must deliver the output. Product inventories and refinery utilisation can remain tight after crude exports start to recover.
Commercial and physical safety form another clock. The International Maritime Organization recorded 68 confirmed incidents across Hormuz and the wider Middle East as at 21 August 2026, including 19 confirmed seafarer fatalities. The register covers a broader region than the strait itself, so it should not be described as 68 incidents inside Hormuz. It still shows that navigation risk persisted after the first recovery in oil flows.
Normalisation requires more than ships moving again. Attacks must stop, crews need credible safety arrangements, insurers must be willing to offer cover at lower war-risk premiums, and cancelled or diverted voyages need to fall. Otherwise the physical route may be open while its commercial capacity remains impaired.
How the shock reaches Australian cash flow
The transmission is a chain rather than a one-day oil-price event.
| Link | What to observe | Where it can appear in Australia |
|---|---|---|
| Physical supply | Loaded crude, product and LNG departures and arrivals | Availability of imported fuel and regional energy cargoes |
| Shipping | Tanker and LNG freight, war-risk cover, delays | Landed fuel cost and working capital tied up in transit |
| Currency | AUD against the US dollar | The local cost of dollar-priced energy |
| Pass-through | Contract resets, fuel surcharges and retail pricing | Airline, freight, mining, retail and household costs |
| Second round | Inflation expectations, demand and financing conditions | Margins, discretionary spending and interest-rate sensitivity |
The currency can amplify or absorb the international move. A stronger Australian dollar can soften a higher US-dollar energy price, while a weaker dollar can keep landed costs elevated after Brent falls. Inventory, hedging and contract lags then determine when a company records the effect.
This is why sector labels are a poor shortcut. An upstream producer may receive a higher realised price but lose volume or incur higher shipping costs. An airline may have fuel hedges and surcharges but still face weaker demand. A miner can be exposed through diesel, freight and contractor rates. Retailers may absorb costs in margin before passing them to customers.
Read company exposure through four accounts
For any company presented as a Hormuz winner or loser, trace the claim through:
- Revenue: Which benchmark or contract actually sets the selling price, and with what lag?
- Operating margin: Which fuel, freight, insurance and power costs move first, and can they be passed through?
- Working capital: Does more cash become trapped in inventory, receivables or longer voyages?
- Balance sheet: Can the company fund a temporary shock without expensive refinancing or an equity raise?
This framework prevents a sector rally from being mistaken for durable cash flow. It also separates a brief price spike from a regime in which product shortages, currency weakness and elevated freight persist.
A weekly decision board
| Clock | Evidence to compare consistently | Sign of genuine recovery |
|---|---|---|
| Access and volume | Laden transits by vessel class; loadings and destination arrivals | Several weeks near a fixed pre-shock range |
| Bypass and inventory | East–West and ADCOP throughput; Yanbu and Fujairah activity; storage withdrawals | High flow without growing terminal queues or repeated inventory draw |
| Products and LNG | Refinery runs, product stocks and cracks; Qatari and UAE LNG loadings | Product and gas tightness eases with crude |
| Cost and safety | Freight, war-risk premiums, cancelled voyages and IMO incidents | Costs retreat and confirmed attacks stop |
| Australian transmission | AUD, landed fuel costs, surcharges and company margins | Local cash-flow pressure eases rather than merely changing hands |
Use one provider and one definition when measuring improvement. Compare the pre-shock average, disruption trough, and current seven- and 28-day averages. Keep crude, refined products and LNG separate. Keep bypass exports separate from Hormuz transits. Otherwise a change in the denominator can look like a change in the system.
What would change the assessment
The conditions that would change the view are observable rather than rhetorical. It would become less cautious if loaded flows returned towards their pre-shock range for several weeks, Saudi and UAE routes sustained high throughput without port congestion, and fresh production replaced storage releases. Falling product cracks, LNG prices, freight and war-risk premiums would show that recovery was spreading beyond crude.
A durable halt in confirmed attacks and credible navigation guarantees would be necessary as well. Safety cannot be averaged away because other indicators improve.
The counter-signals would keep risk elevated: another fall in loaded volumes, growing queues at Yanbu or Fujairah, repeated reliance on inventory, worsening LNG or refined-product availability, or persistent insurance and crew-safety warnings. A softer diplomatic statement would not outweigh those observations.
Hormuz is a network, not a switch
Bypass pipelines materially reduce the damage from a Hormuz disruption. They do not solve it. Their spare capacity is much smaller than the usual flow through the strait, their terminals can become the next bottleneck, and they offer no equivalent route for LNG.
Official evidence available to 25 August 2026 still describes an incomplete recovery. July loadings weakened after an early rebound, refined-product markets remained tighter than crude, and confirmed maritime incidents continued in August. Australian investors should therefore follow loaded energy, terminal performance, LNG, insurance, freight and the Australian dollar before turning a geopolitical headline into a company cash-flow conclusion.
This is general information, not personal financial advice or a recommendation to buy or sell any security.
Sources
- International Energy Agency, Strait of Hormuz factsheet
- US Energy Information Administration, August 2026 global energy-security data
- International Energy Agency, Oil Market Report — August 2026
- US Energy Information Administration, United Arab Emirates analysis
- International Maritime Organization, Middle East highlighted confirmed incidents
- International Maritime Organization, Strait of Hormuz information hub
- UK Maritime Trade Operations, maritime security advisories
Update note
Revision history
Iran sanctions and Hormuz recovery: two evidence chains continues the series by separating legal enforcement from measured revenue and vessel transit from delivered cargo.
More through this lens