The Regime Investor· ·7 min read
Can MACD pick a market top? Trend confirmation and risk control
Understand the MACD line, signal line, histogram and divergence, then turn them into position-sizing, no-trade and re-entry rules.
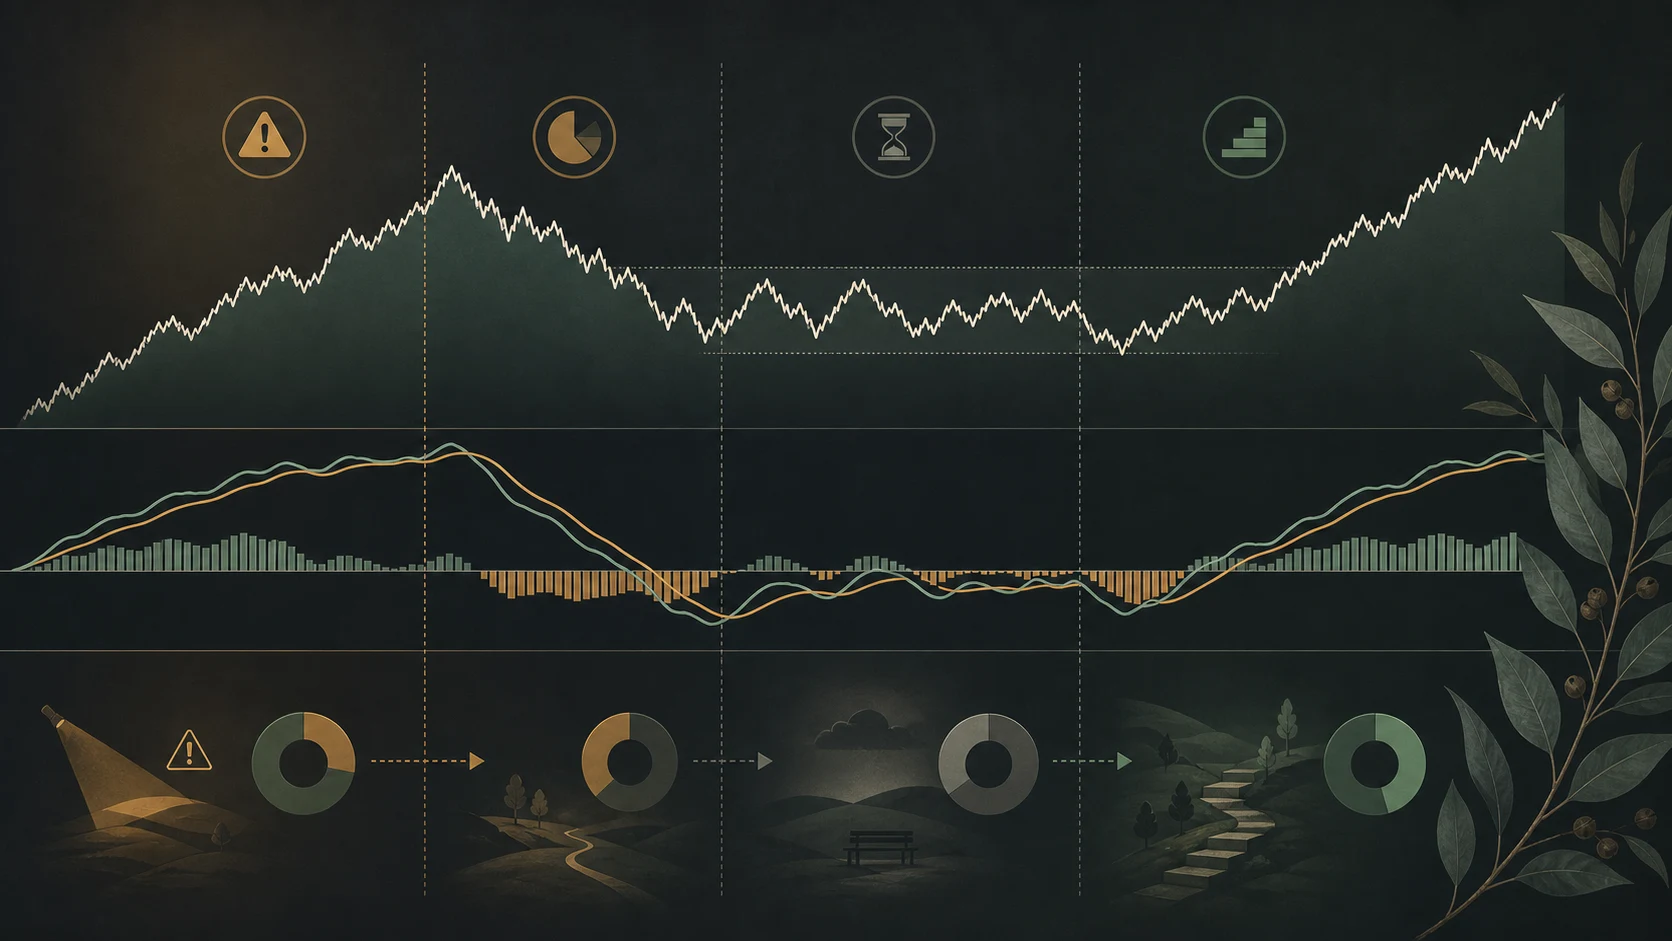
MACD is one of the most familiar indicators on a chart. When its lines cross or the histogram begins to shrink, the move can look like an early warning that a market top or bottom is close. But MACD does not observe the future. It recalculates price action that has already occurred.
That does not make it useless. Its more defensible role is to turn a vague impression about momentum into a repeatable risk-control process: when to become cautious, when to reduce exposure, when to do nothing and what would justify re-entry.
What the MACD line, signal line and histogram calculate
The standard MACD setting subtracts a 26-period exponential moving average from a 12-period exponential moving average. That difference is the MACD line. A 9-period exponential moving average of the MACD line becomes the signal line, and the difference between the two lines is plotted as the histogram.
- MACD line: short-term exponential moving average minus long-term exponential moving average
- Signal line: an exponential moving average of the MACD line
- Histogram: MACD line minus signal line
These are not three independent pieces of evidence. They are three related views of the same underlying price series. A crossover and a change in the histogram can arrive together without adding a second independent source of information.
The Fidelity MACD guide describes MACD as a momentum oscillator used mainly in trending markets and notes that repeated crossovers can create whipsaw in trading ranges.
A crossover records a change in state, not a forecast
When the MACD line moves above the signal line, short-term momentum has strengthened relative to its recent average. A move below the signal line indicates weakening momentum. Whether both lines sit above or below zero can add context about the direction of the prevailing trend.
The signal arrives after price has moved because moving averages are built from past prices. Faster settings react earlier but can create more false signals. Slower settings may filter some noise but respond later.
This delay is both a limitation and a design choice. MACD is unlikely to identify the exact highest sale price. It can instead make an investor wait for a sustained change rather than reacting to one emotional session. The useful question becomes not “Did it call the top?” but “Did the rule reduce risk in a way that can be tested?”
What a shrinking histogram actually means
A positive and expanding histogram means the gap between the MACD and signal lines is widening. If the histogram remains positive but begins to shrink, upward momentum may still be present even though the gap between the lines is narrowing.
A smaller bar does not mean price must fall next. In a strong trend, momentum can slow and then accelerate again. In a range-bound market, the histogram may cross zero repeatedly. Price structure, volume and market breadth should be checked before treating a change in the bars as a risk event.
Divergence is a warning, not an automatic sell order
Bearish divergence is often described as price making a higher high while MACD or its histogram makes a lower high. It may indicate that the pace of the advance is weakening. Bullish divergence reverses the pattern: price makes a lower low while the indicator makes a higher low.
The difficulty is that a person must choose which highs and lows to compare. Different windows can produce different lines, and divergence can persist while price continues in the same direction. It is more useful as a prompt to define confirmation than as a command to trade.
Before acting, ask:
- Has price broken a pre-defined trend line, support level or market structure?
- Was the crossover confirmed at the chosen closing interval rather than intraday?
- Do volume and market breadth confirm the same deterioration?
- Have credit conditions, rates or earnings expectations changed as well?
- What would invalidate the warning and permit re-entry?
An index and an individual share need different checks
A broad index such as the S&P/ASX 200 spreads company-specific risk across many holdings, although a concentrated group of large companies can still dominate the signal. Using MACD to adjust broad market risk can therefore be easier to interpret than using it as the sole reason to buy or sell one company.
For an individual ASX share, the chart cannot replace earnings, cash flow, balance-sheet strength, announcements, liquidity and trading-halt risk. A technically weak chart may reflect a real deterioration, but the indicator does not identify the cause.
A usable risk-control rule needs sizing, no-trade and re-entry conditions
“Sell when MACD turns down” is not a complete process. The time interval, confirmation point, amount of exposure to change and conditions for rebuilding the position all need to be fixed before the signal occurs.
One observation framework could be:
- Fix the index or security and the daily or weekly interval.
- Record the MACD settings and whether signals are confirmed at the close.
- Treat divergence alone as a caution stage rather than an automatic exit.
- Reduce only a pre-defined portion when a bearish crossover and a price-structure break occur together.
- Rebuild exposure in stages if the warning is invalidated or an upward crossover is confirmed alongside improving breadth.
- Use a no-trade rule when repeated crossovers show that the market is range-bound.
This is an example of a testable process, not a strategy that guarantees profit. The appropriate exposure, holding period and security depend on risk capacity, tax, brokerage, spreads and liquidity. Charles Schwab’s moving-average guidance similarly notes that moving-average signals can fail and that adding to or subtracting from positions gradually may be more prudent than treating every crossover as an all-or-nothing instruction.
Why MACD alone is not enough
The MACD line, signal line and histogram all come from price. Counting them as separate confirmations exaggerates the amount of evidence. A stronger decision process asks whether information from other transmission channels agrees:
- Market breadth: is the move broad or concentrated in a few large shares?
- Volume and liquidity: is participation expanding or thinning?
- Discount rates: are long-term and real yields changing the valuation pressure?
- Credit: are spreads, funding and issuance conditions deteriorating?
- Real economy: are earnings revisions, orders, inventories or employment confirming the trend?
The broader article Why technical indicators cannot prove 90% odds explains why several price-derived indicators do not automatically create independent evidence or a defensible probability.
Conditions that would change the assessment
A MACD rule becomes more credible when its settings, position changes and re-entry rules are fixed before the outcome is known and every signal is recorded in order. The test should include brokerage, spreads, slippage, tax where relevant, whipsaw losses and missed upside.
The target also needs to be defined in advance. Is the rule intended to reduce maximum drawdown, downside volatility, repeated false trades or the risk of a large single loss? A rule may improve one of those outcomes without improving total return.
The view would weaken if the rule only works after the divergence window or settings are changed to fit past results, if range-bound markets produce repeated losses, or if gaps prevent execution near the planned price. It would strengthen if the same pre-registered process remains useful on unseen data and across different market regimes after costs.
A tool for reducing mistakes, not predicting the exact turning point
MACD cannot reliably identify the highest or lowest price. It is a lagging transformation of price and can miss the final part of a trend or generate repeated false signals in a range.
Its practical value is more modest. If the signal is defined in advance and connected to partial de-risking, a no-trade condition and a re-entry rule, it can reduce impulsive all-in or all-out decisions. The standard should be whether the process is repeatable and limits damage when it is wrong, not how often it appears to have picked a perfect turning point.
This article provides general information only. It does not take account of any person’s objectives, financial situation or risk tolerance and is not a recommendation to buy or sell a particular security or product.
Sources
More through this lens